In today's data-driven world, visualizing information is more important than ever. That's where Notion charts come in.
Imagine having your data at your fingertips, beautifully visualized and ready to share or analyze. Notion, a powerhouse for organization and productivity, offers tools that make data visualization a breeze. You can create charts directly in Notion or integrate third-party tools to craft the perfect chart for your needs. Whether you're tracking project progress, analyzing sales data, or planning your next big move, Notion charts can make the difference.
Ready to explore how you can leverage these tools for better insights? Let's dive in!
Understanding Notion Charts
Let's dive into the world of Notion charts! These handy tools are all about turning raw data into engaging visuals. Ever felt overwhelmed by rows and rows of numbers? Notion charts can transform that chaos into clarity. They're not just about making your data look pretty; they boost your productivity and data management skills.
Types of Charts:
- Bar Charts: Great for comparing different categories or tracking changes over time. Imagine if you could easily see your team's progress month by month. Bar charts let you do just that!
- Pie Charts: Perfect for showing proportions. Have a budget to manage? A pie chart can break it down visually, helping you see where your money goes.
- Line Charts: Track trends over time. If you're monitoring sales growth or website traffic, line charts help you spot patterns quickly.
- Scatter Plots: Ideal for spotting relationships between variables. Ever wondered how two metrics relate? Scatter plots give you the answer.
Applications in Notion:
You can use Notion charts in various ways. Embed them in your project dashboards to keep everyone on the same page. Or, place them in reports to make data-driven decisions a breeze. The possibilities are endless!
Remember, Notion charts aren't just about data; they're about insights. They help you see the big picture and make informed choices. So, ready to level up your data game? Let’s get charting!
Factors to Consider Before Choosing a Notion Chart Editor
Choosing the right chart editor for Notion charts can feel like navigating a maze, but it doesn't have to be! Here are some key factors to consider before making your choice:
- Data Manipulation Flexibility: Imagine if you could tweak your data effortlessly! You'll want an editor that lets you manage data without breaking a sweat. Look for tools that offer drag-and-drop features or easy formula integrations.
- Automation Capabilities: Who doesn't love saving time? Automation can be your best friend here. Consider editors that update your charts automatically when your data changes. This ensures your charts are always up-to-date, without lifting a finger.
- Customization Options: Personalization is key. You should be able to tailor your charts to fit your style and needs. Whether it's changing colors, labels, or chart types, having ample customization options is a must.
- Mobile Responsiveness: We're on the go, and so is our data. Ensure your chosen editor performs seamlessly on mobile devices. You should be able to view and edit your notion charts on the fly, without any hiccups.
So, take a moment to ponder these points. With the right editor, you can transform your data into beautiful, insightful visuals that enhance your productivity. Ready to find your perfect fit? Let's get started!
5 Ways to Build Notion Charts
Creating Notion charts can seem daunting, but with the right tools, it's a breeze! Let's explore five ways you can transform your data into visual masterpieces.
Looking for more tools, widgets, and other powerful tools for our Notion? Check our list of the best options here.
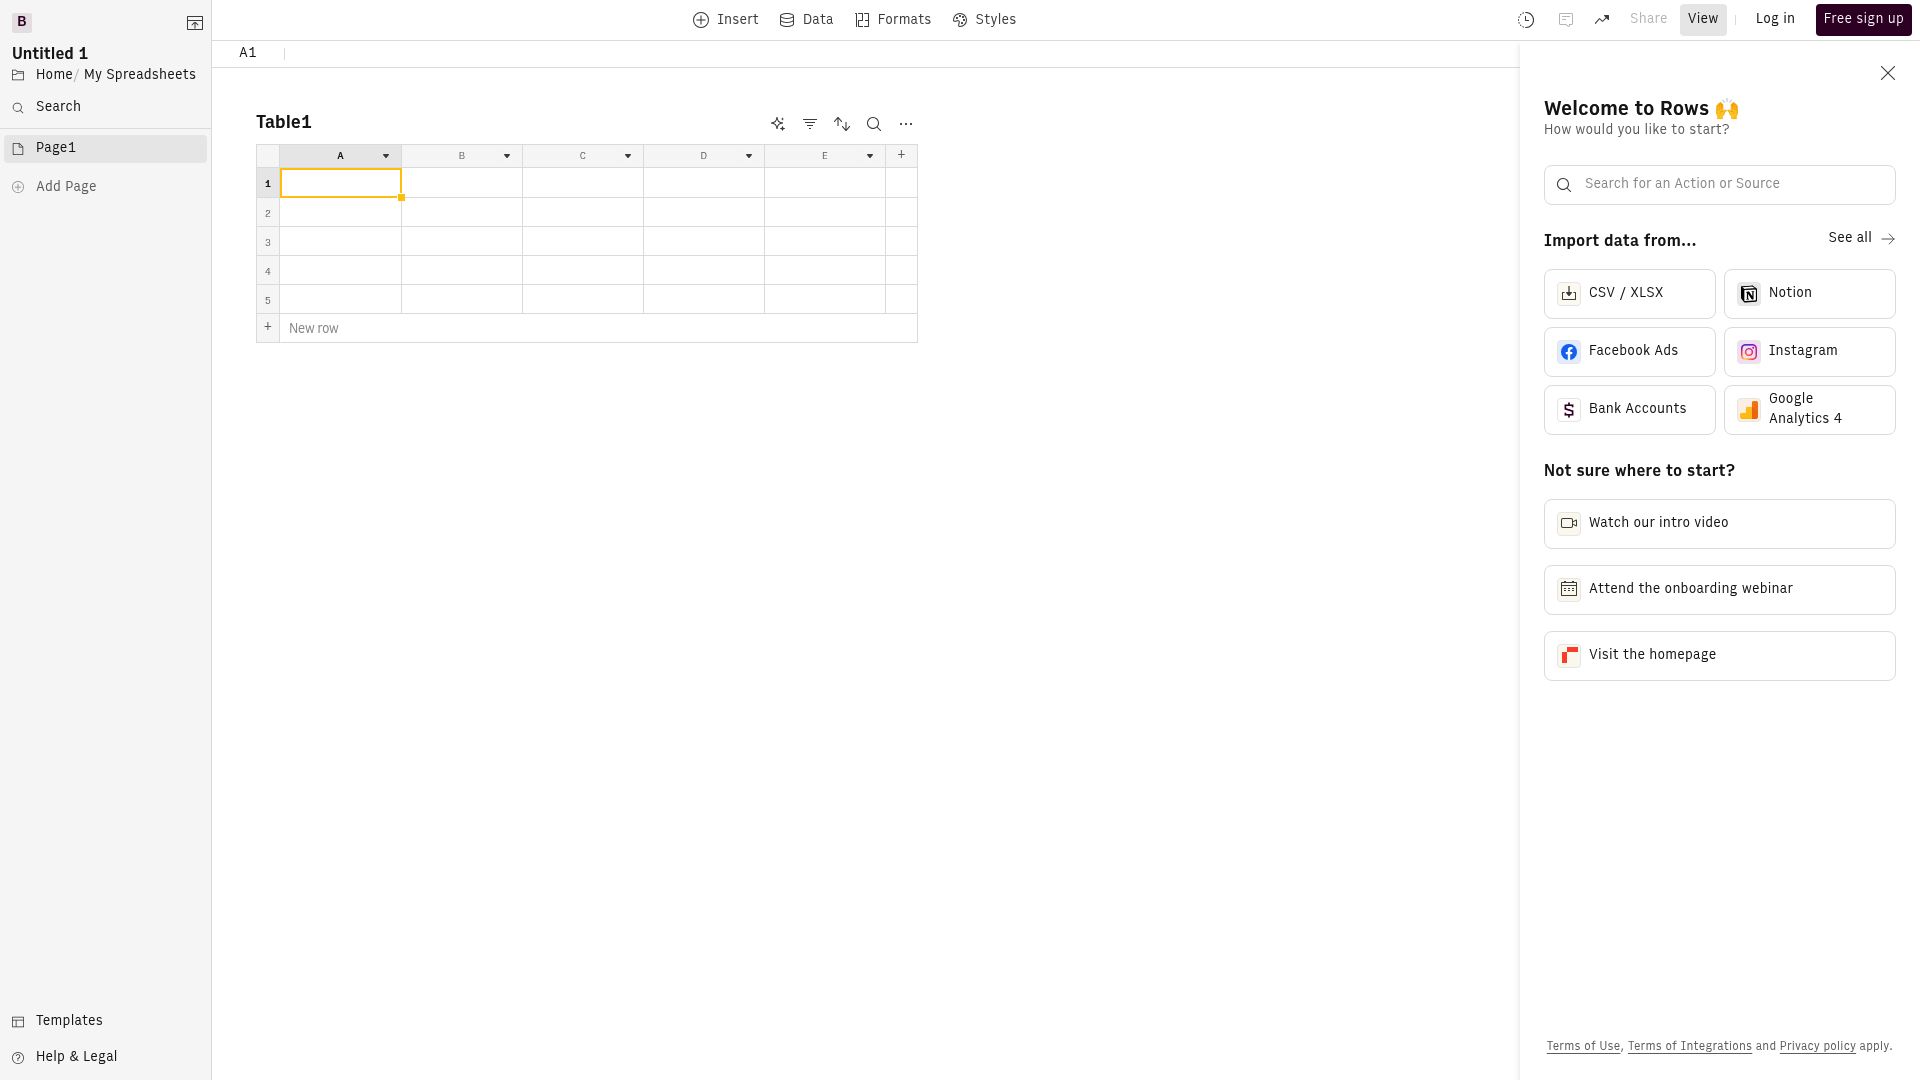
1. Rows
Imagine having a tool that makes chart creation seamless. Rows does just that. With its intuitive interface, you can easily integrate charts into Notion. Start by importing your data into Rows. Choose from various chart types to fit your needs. The best part? You can customize colors, labels, and more!
- Import Data: Add your dataset into Rows.
- Select Chart Type: Choose the perfect chart for your data.
- Customize: Tweak colors, labels, and more to match your style.
- Embed in Notion: Effortlessly embed your chart with a simple link.
Rows offers real-time updates, meaning your charts stay current as your data changes. It's like having a dynamic dashboard at your fingertips.
2. Notion
Why seek external tools when Notion itself offers native charting features? Creating Notion charts directly in the platform is straightforward. Here's how:
- Create a Database: Start with a table or list view.
- Visualize Data: Use Notion's built-in options to create bar, pie, or line charts.
- Customize: Adjust the chart to suit your needs—change colors or data points.
- Embed: Seamlessly integrate the chart into your Notion pages.
Using Notion's tools means everything stays in one place, enhancing productivity. Plus, the native integration ensures stability and ease of use, ideal for quick data visualization.
3. NoChart
NoChart offers a unique approach to creating charts. It integrates directly with your Notion databases, making the process smooth. Here's a quick guide:
- Connect Database: Link your Notion database to NoChart.
- Choose Chart Type: Select from a variety of customizable charts.
- Personalize: Modify aspects like colors and labels to make it your own.
- Embed: Use a simple code to embed the chart into Notion.
NoChart's standout feature is its seamless database integration, ensuring your charts reflect real-time data changes. It's like having a live data feed, right in your Notion workspace.
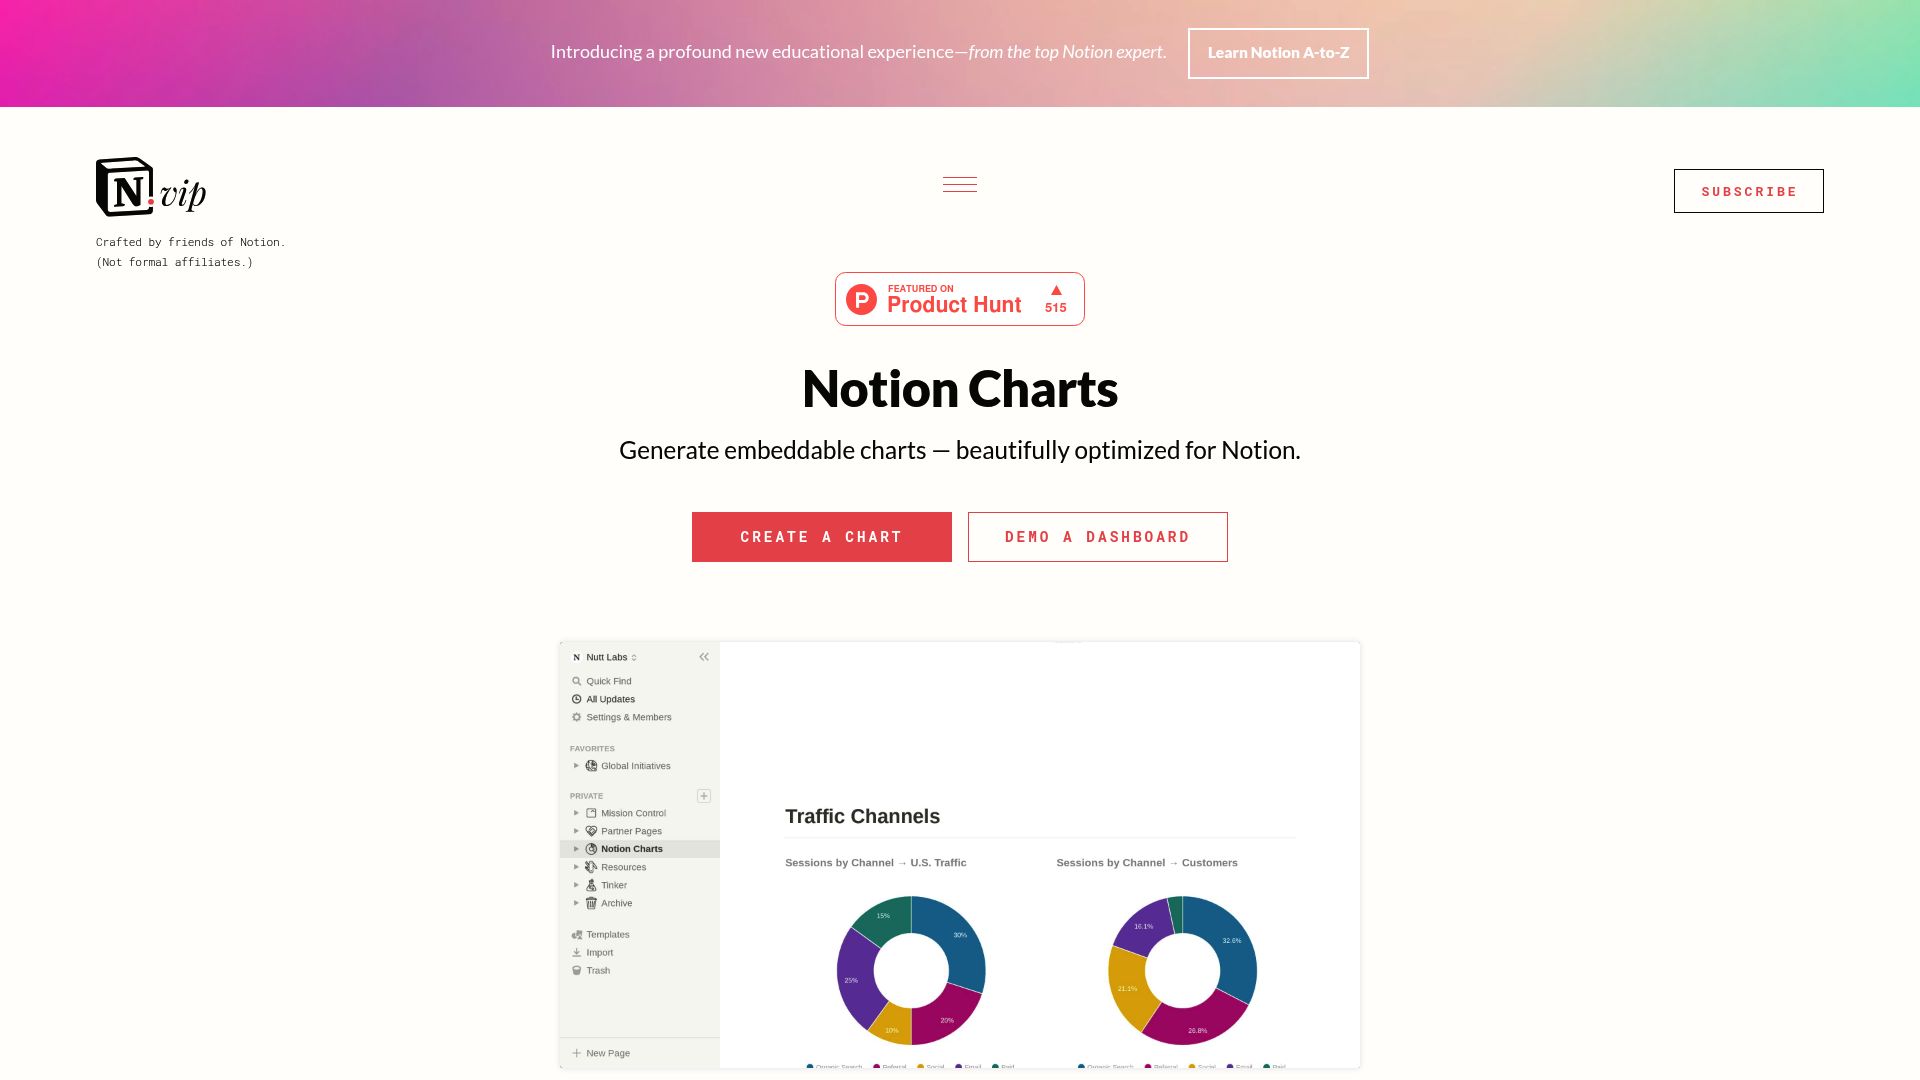
4. NotionVIP
NotionVIP is all about ease of use and powerful integrations. With its direct Google Sheets link, you can import data effortlessly. Here's how to get started:
- Import Data: Connect your Google Sheets to NotionVIP.
- Select Chart Type: Pick the chart that best represents your data.
- Customize and Embed: Tailor it to your liking and embed it into Notion.
The friendly interface makes chart creation a joy. Plus, the Google Sheets integration ensures your data is always up-to-date. It's like having a personal assistant for your data tasks.
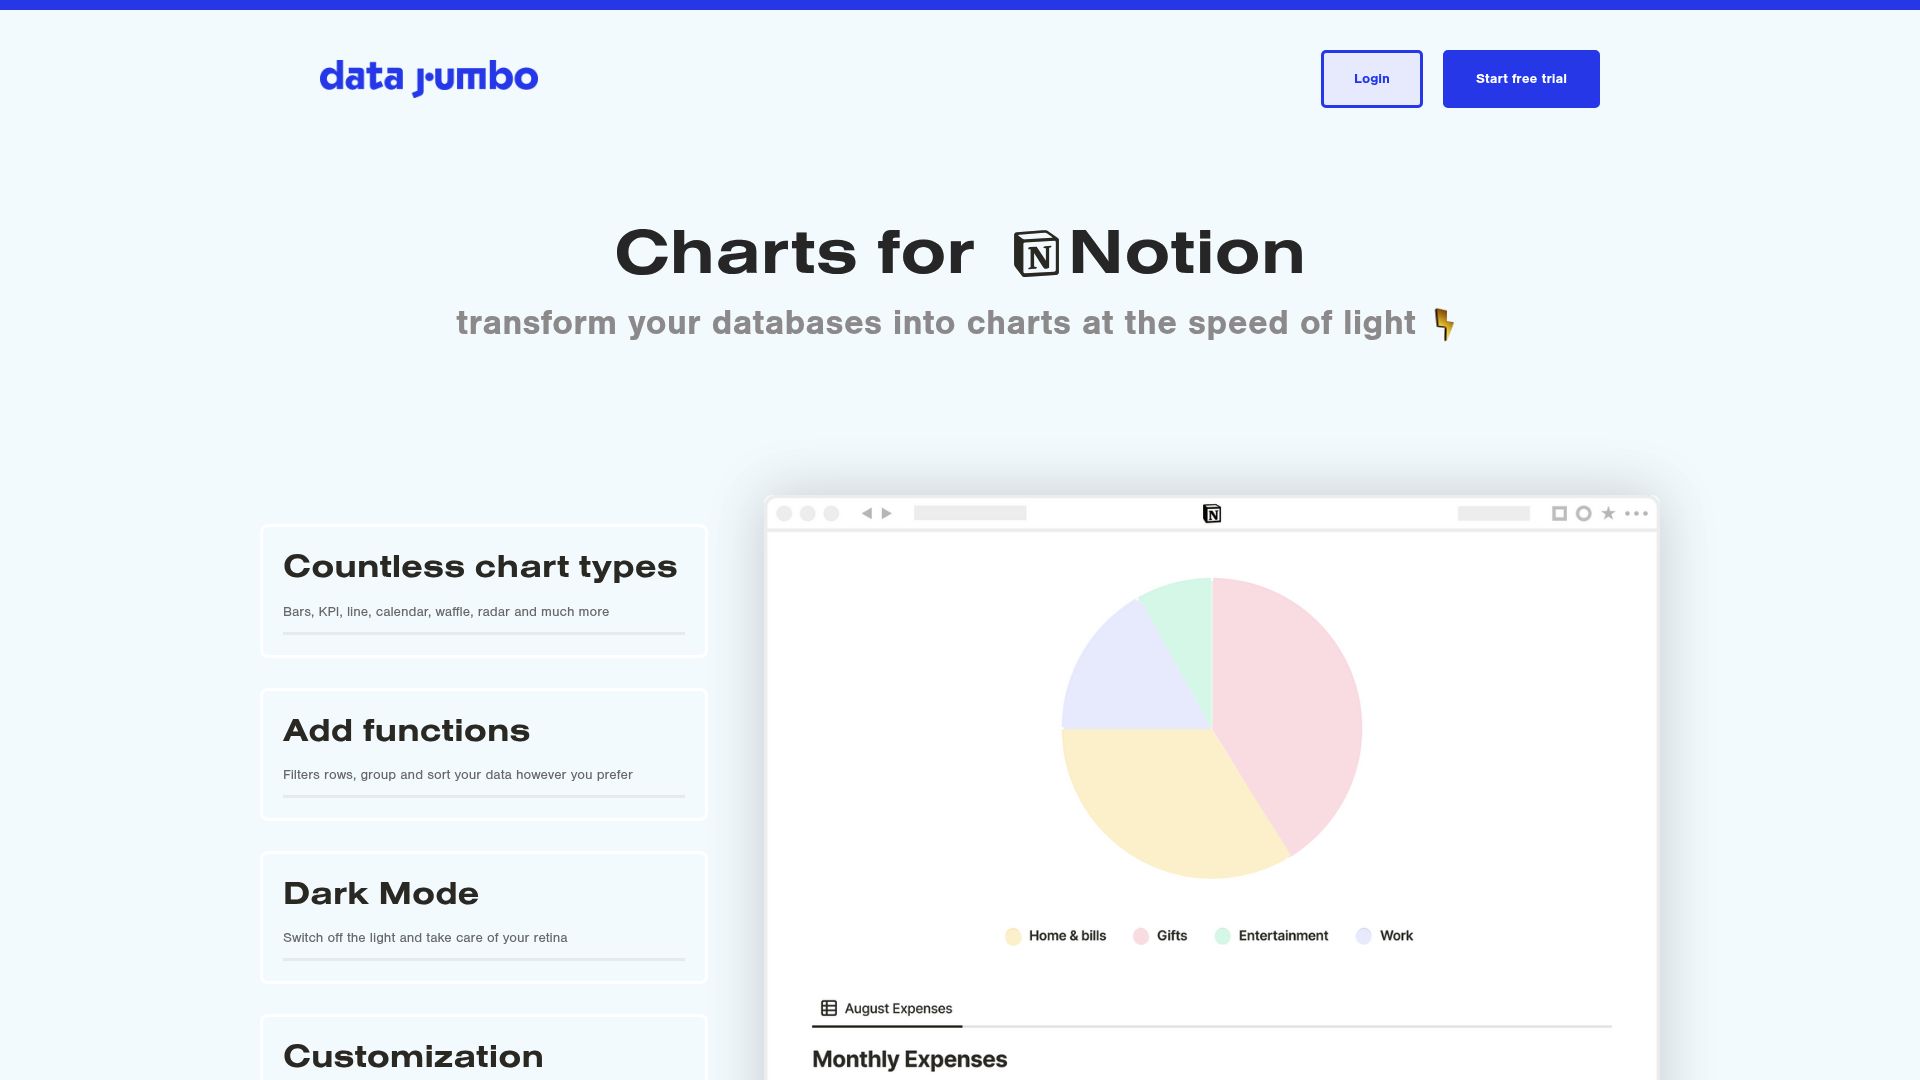
5. Data Jumbo
Last but not least, Data Jumbo brings flexibility and customization to your Notion charts. Here's how you can use it:
- Connect Database: Link Data Jumbo with your Notion data.
- Customize Charts: Choose from various types and personalize them.
- Embed with Ease: Integrate your charts into Notion effortlessly.
Data Jumbo shines with its comprehensive customization options. You can tweak every detail, ensuring your charts are not only informative but also visually appealing. It's like having a designer at your disposal, ready to make your data pop.
With these methods, creating Notion charts becomes a simple and enjoyable task. So, which one will you try first?
Best Practices for Notion Chart Integration
Integrating Notion charts effectively can elevate your data game. Let's explore some best practices to make your charts stand out and be useful.
1. Ensure Clarity and Simplicity
Keep your charts simple. Avoid cluttering them with too much data. Imagine if you could grasp insights at a single glance! Use clear labels and contrasting colors to enhance readability.
2. Maintain Data Accuracy
Nobody likes outdated information. Regularly update your charts to reflect the latest data. Many tools offer automation features—embrace them! This ensures your Notion charts are always trustworthy.
3. Optimize for Readability
Ask yourself, "Can anyone understand this?" Use larger fonts and clear headings. A well-designed chart communicates effectively, even to a novice.
4. Consistent Style
Keep a consistent color scheme and layout. This creates a cohesive look across your Notion workspace, making it visually appealing.
5. Leverage Interactive Features
Whenever possible, use interactive elements. They allow users to engage with the data, fostering a deeper understanding. Imagine if users could explore data points themselves!
Remember, Notion charts are more than visuals; they are tools for insights. By following these best practices, you'll ensure your charts not only look good but also serve their purpose efficiently!
Enhancing Productivity with Notion Charts
Ever felt like your data is just sitting there, collecting dust? Notion charts can be a game-changer. They transform raw numbers into insights, boosting productivity and decision-making. Imagine if you could make data-driven decisions quickly and with confidence. That's the power of effective data visualization.
Notion charts allow teams to see the big picture at a glance. Let's say you're managing a project. A well-designed chart can highlight progress, showing which tasks need immediate attention. This means fewer surprises and more control over timelines.
Think about sales teams. Tracking monthly targets becomes a breeze with Notion charts. They can spot trends, identify winning strategies, and adjust tactics in real time. It's like having a roadmap to success.
Collaboration is also enhanced. When everyone sees the same data clearly, discussions are more productive. Instead of getting bogged down in numbers, teams can focus on solutions. So, ready to let Notion charts take your productivity to the next level? Let's make your data work for you!
As you dive into the world of Notion charts, you're opening the door to a whole new level of productivity and data management.
Whether you're using Rows for real-time updates or leveraging Notion's native features for seamless integration, each method holds the key to transforming your workflows. The true magic happens when you tailor these tools to your personal or professional needs.
Ready to take your organization game to the next level? Organize your entire life with Notion Second Brain.